Create X-Y Signal
Description
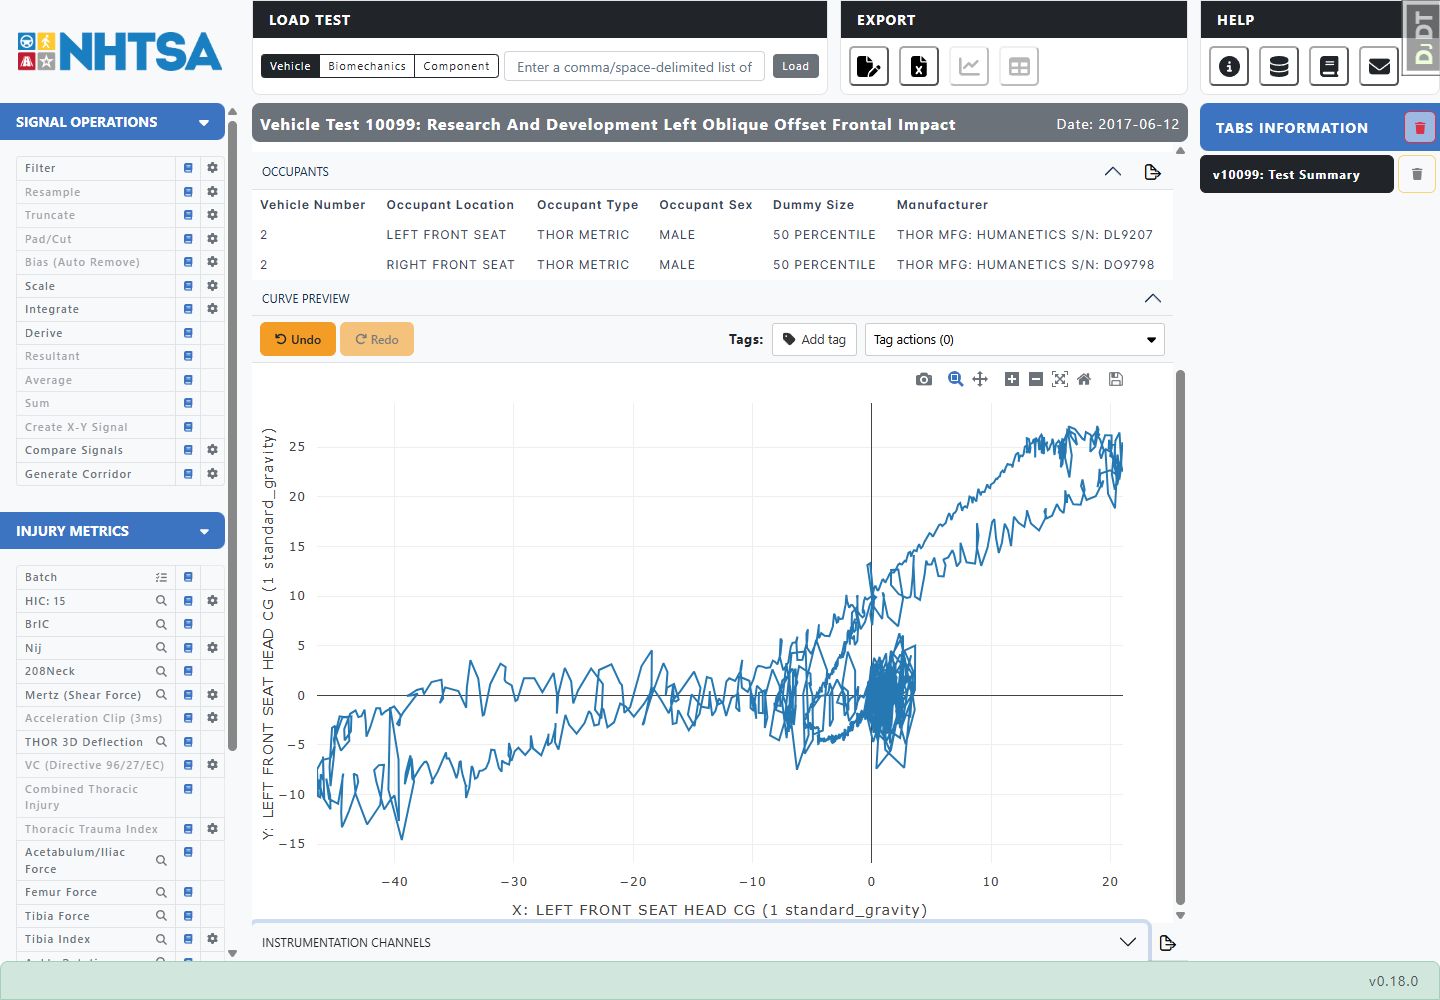
Create X-Y Signal plots one selected signal against another instead of plotting both against time. Use it for relationships such as force versus displacement.
When this feature is available
Create X-Y Signal becomes available when the selected curves meet the requirements.
For the selection to pass:
- Exactly two curves must be selected.
WebSAT enables Create X-Y Signal only when the selection contains the two curves needed for the X and Y axes.
Settings
This feature has no settings. Selection order determines which curve supplies the X values and which supplies the Y values.
How WebSAT processes the data
- Load the two selected source curves.
- Confirm that the curves contain the same number of samples.
- Use the first curve's values as X and the second curve's values as Y.
- Pair the values by their existing sample positions. WebSAT does not align or resample the curves for this operation.
- Assign each source curve's signal units to the corresponding axis.
- Create and display the X-Y curve while preserving both source curves.
Results
The operation produces one new selected X-Y curve. Inspect the axis labels before interpreting its direction or slope.
References
No injury criterion or external reference value is applied.