Filter
Description
Filter reduces high-frequency content in selected time-history curves. WebSAT provides Butterworth channel frequency class (CFC) filters and an FIR100 filter so you can apply the processing required by the test procedure [1] [2] [3].
When this feature is available
Filter becomes available when the selected curves meet the requirements.
For the selection to pass:
- At least one curve must be selected.
WebSAT enables Filter as soon as one or more curves are selected and applies the selected filter to each curve independently.
Settings
| Setting | Default | Options |
|---|---|---|
| Filter | CFC60 | CFC60, CFC180, CFC600, CFC1000, or FIR100 |
Use the CFC required for the measurement and governing procedure. A higher class retains more high-frequency content.
How WebSAT processes the data
- Load each selected curve and convert its time axis to seconds.
- Determine the curve's sample interval and sampling rate.
- Apply the selected Butterworth CFC or FIR100 processing path.
- Create and display the filtered curve while preserving the original.
Butterworth CFC filters
For CFC60, CFC180, CFC600, or CFC1000, WebSAT:
- pads the curve ends with at least 10 milliseconds of data when needed;
- calculates the Butterworth coefficients for the selected SAE channel frequency class; and
- filters forward and backward to minimize phase shift.
If the curve already has a prefilter frequency at or below the requested cutoff frequency, WebSAT retains the curve values instead of filtering them again.
FIR100 filter
For FIR100, WebSAT follows the processing sequence in 49 CFR 572.44(d) [3]:
- apply a CFC 180 Butterworth prefilter;
- resample the curve to 1,600 samples per second;
- remove the signal's zero offset; and
- apply the FIR100 coefficients symmetrically so the result is not shifted in time.
Results
Each input produces a new selected curve. The original curve remains available for comparison.
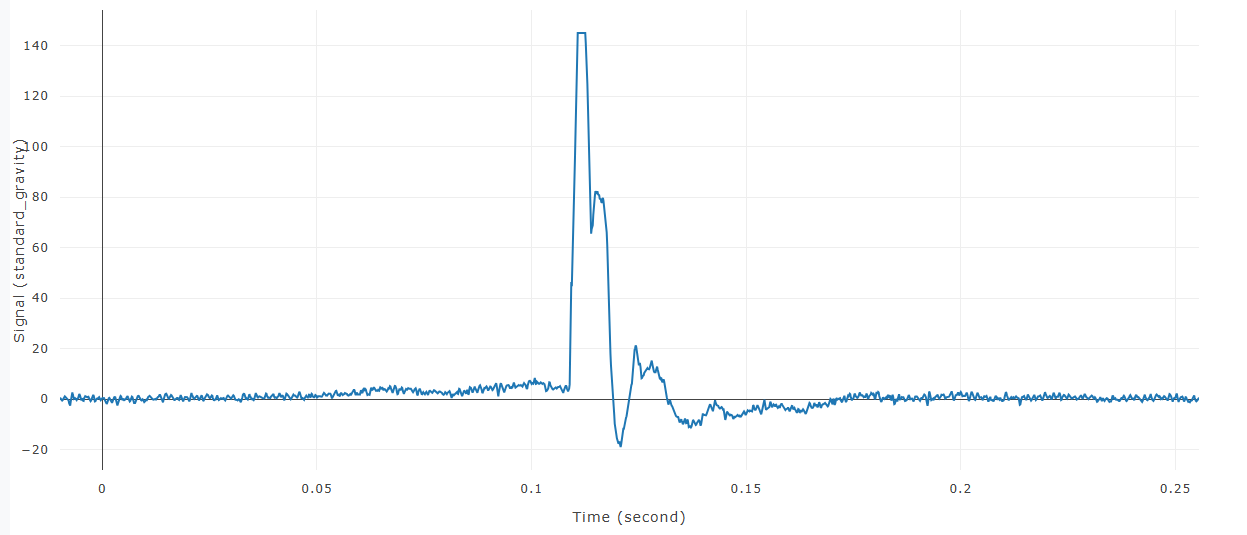
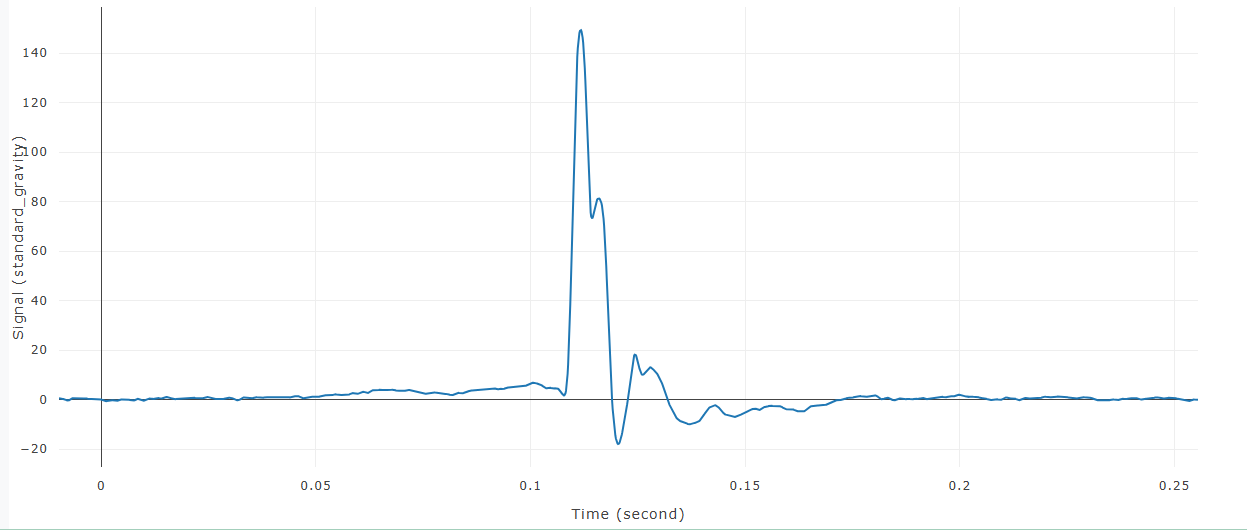
Butterworth CFC example
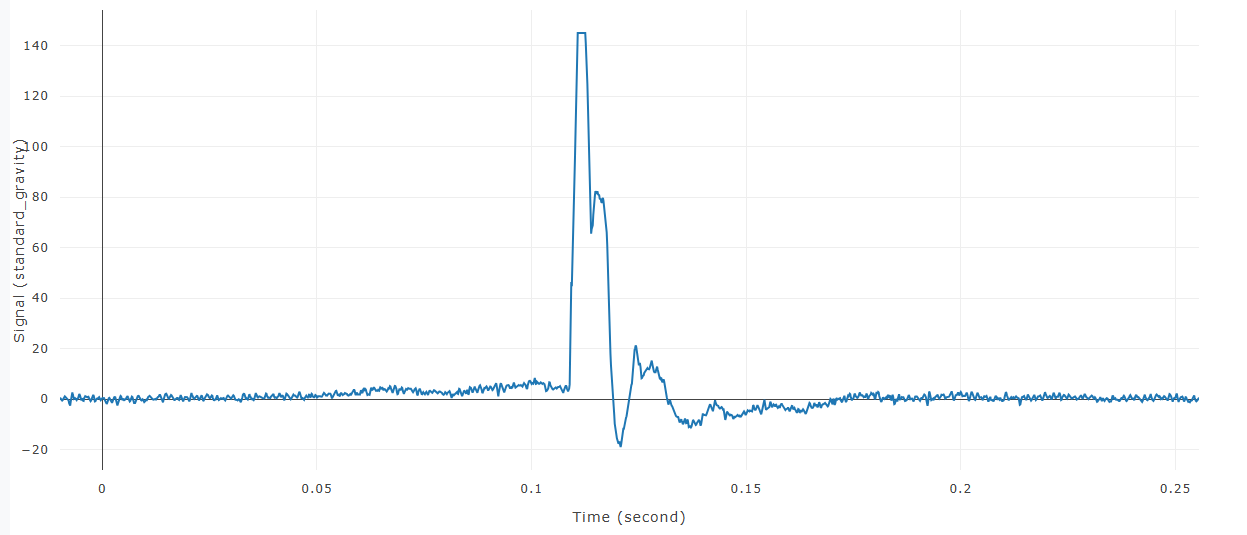
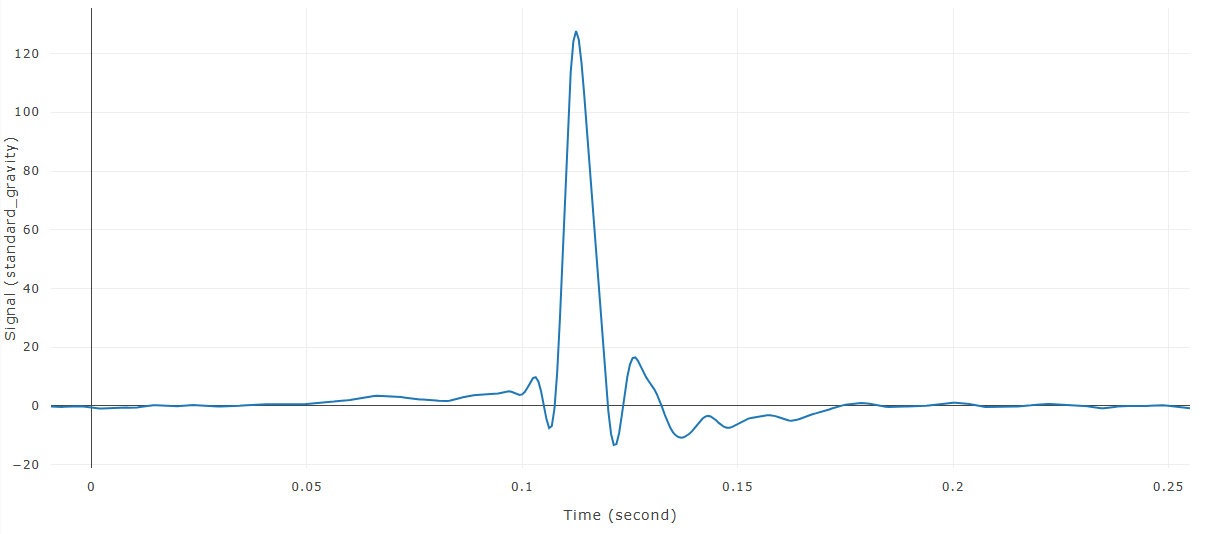
FIR100 example
References
[1] SAE International. Instrumentation for Impact Test—Part 1—Electronic Instrumentation. SAE Recommended Practice J211/1.
[2] SAE International. Calculation Guidelines for Impact Testing. SAE Recommended Practice J1727, https://doi.org/10.4271/J1727_201002.
[3] 49 CFR 572.44(d), Part 572 Anthropomorphic Test Devices—Part 572 Test Dummy Instrumentation. https://www.ecfr.gov/current/title-49/subtitle-B/chapter-V/part-572