Getting Started
This walkthrough covers the WebSAT workspace and the basic workflow: load a test, inspect its signals, run a function, review the result, and export the information you need.
1. Load a test
Under Load Test, select Vehicle, Biomechanics, or Component. Enter one or more test numbers, separated by a comma or a space, and select Load. Each entered number appears as a removable item before loading. WebSAT removes duplicate numbers and loads them in numeric order.
A single test opens its own test summary. Multiple test numbers from the same database open a combined summary so that you can compare their available signals. After a successful load, WebSAT clears the entry field. If a test cannot be found or its data cannot be loaded, WebSAT shows a message and does not create a usable result for that test.
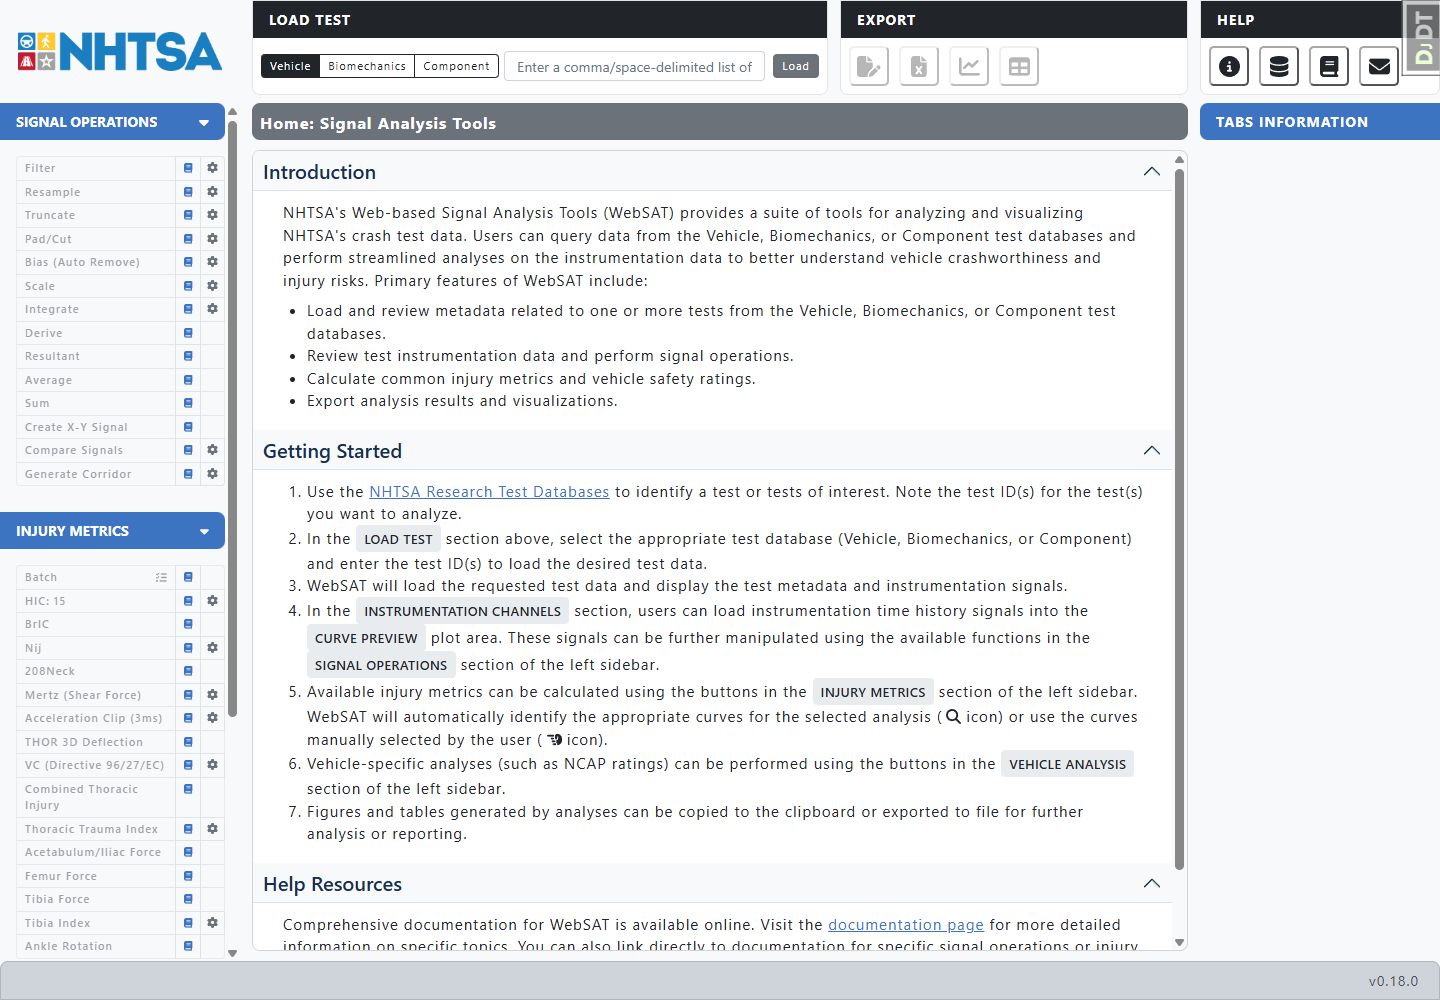
The center panel shows the test title and the available record sections. These can include test information, vehicles, occupants or test subjects, component details, and instrumentation channels. Select a section heading to collapse or expand it.
Use Tabs Information on the right to manage the workspace:
- Select a tab name to make it active.
- Expand or collapse a test group to show or hide its result tabs.
- Remove one result tab or a complete test group with its remove control.
- Select Clear All Tabs to close all workspace tabs.
Closing a tab removes that view and its current workspace state. It does not delete the test record. Load the test again if you need a new workspace.
2. Inspect and select signals
Each row in the instrumentation table is one signal channel. Select the check box at the start of a row to add that channel to the current selection and the Curve Preview plot.
- Select a column heading to sort the table.
- Use the controls below the headings to filter by test, curve, vehicle or subject, sensor location, attachment, axis, sensor type, units, data status, channel status, or commentary.
- Use the page controls to move through long channel lists and the horizontal scroll bar to view more columns.
- Select Clear Curve Selections to clear the current selection.
- Select Reset Table Filters to remove all table filters.
- Select a vehicle or subject information control in a row to view its details.
Use the plot controls to zoom, pan, reset the view, download an image, or save the plotted values to CSV. Hover over the plot to inspect point values. Confirm the axis labels, units, time range, and signal shape before calculating a result.
Workspace controls
- Undo reverses the last signal operation in the current workspace.
- Redo restores an operation that you reversed.
- Add tag lets you select and label a point in the plot.
- Tag actions lets you show, hide, edit, or delete workspace tags.
Undo and redo apply to derived-signal work. They do not change the loaded test data.
For operations such as Filter, Truncate, and Derive, select one or more curves. Operations such as Average, Sum, Resultant, Compare Signals, and Generate Corridor require multiple compatible curves. The function's page lists its exact availability requirements.
3. Run a function
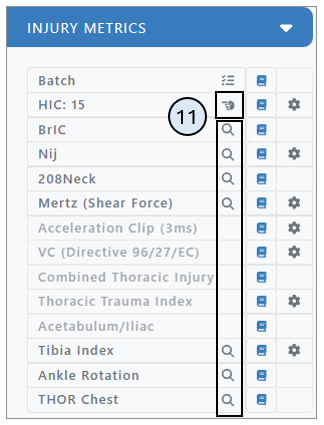
Choose a function from the left sidebar. A disabled button means the current test or selection does not meet that function's availability requirements.
- Select the settings control next to a button when you need to change its exposed options.
- Select the curve identification control for an injury metric when you want WebSAT to locate qualifying channels automatically or review the selected channels.
- Select the main button to run the operation or calculation.
4. Review the result
WebSAT opens a result tab after a successful calculation. Depending on the function, the tab may contain a summary table, processed curves, time-history plots, risk curves, reference values, or an interactive visualization. When multiple occupants or test locations qualify, use the result controls to move between them.
Before using a result, confirm the test number, occupant or sensor location, input channels, units, selected settings, and reported peak time.
5. Export results
Select the test or result tab that contains the information you want before you export it.
Export a plot
Move the pointer over a plot to show its controls.
- Select the camera control to download the plot as an image.
- Select Save Data to CSV to download the values used by the plot.
The CSV contains the plotted series. It is not a complete metadata export.
Export a table
Select Export Table in a table section, and then select an action:
| Action | Output |
|---|---|
| Download Table to PDF | PDF file |
| Download Table to CSV | CSV file |
| Download Table to JSON | JSON file |
| Copy Table to Clipboard | Tab-separated table text |
| Copy Table to Clipboard (Transposed) | Tab-separated text with rows and columns exchanged |
| Copy JSON to Clipboard | JSON text |
Table exports use the data supplied by that table section. Check the active filters and exported content before you use the file.
Generate a report
Select Generate Report in the top Export group. WebSAT collects supported tables and figures from the active tab and opens a landscape, letter-size PDF in a new browser window. Review the PDF before you save or share it because the report contains only the content made available by the active page.
Export all metadata
Select Export All Metadata in the top Export group to create an Excel workbook for the test numbers in the active tab.
- A single-test workbook separates the available metadata into sections.
- A multiple-test workbook combines matching sections and includes the source test number in each row.
- A component-test workbook can include Test, Vehicle, Component, Configuration, Instrumentation, Geometry, Result, Pedestrian Protection, Photos, Videos, and Reports sheets when that information is available.
WebSAT shows a message if no metadata is available or if the export fails. The top-level Save Figures and Save Tables controls are not available. Use each plot or table export control instead.
6. Continue processing
To calculate several available injury metrics together, use Batch. Batch processing uses each metric's current settings and reports successes, unavailable metrics, and calculation errors in one summary.
For details, open the documentation control beside any WebSAT button or use the matching page in this guide's sidebar.