THOR Chest Deflection Visualization
Overview
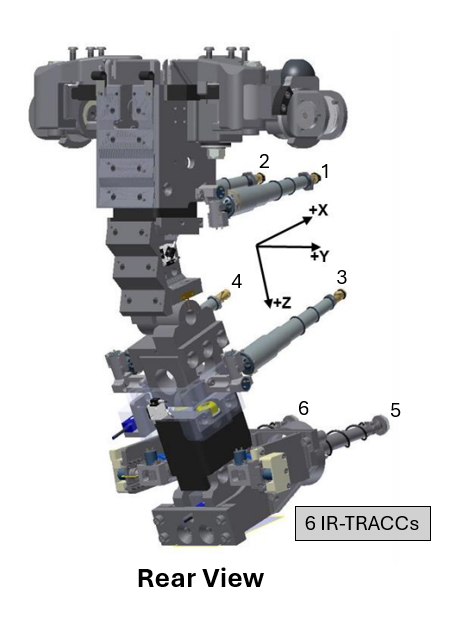
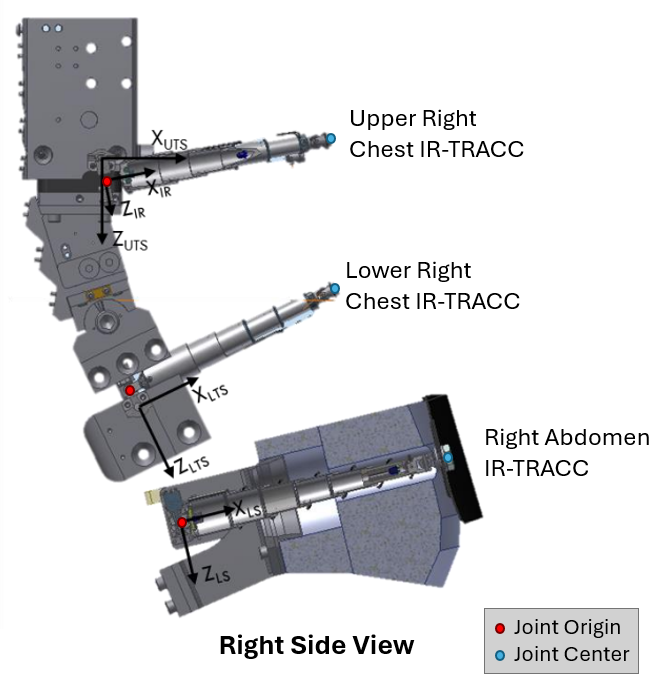
This test metric creates a visualization of the THOR dummy's chest during a crash impact using displacement data measured by IR-TRACC sensors (Infrared Telescoping Rod for the Assessment of Chest Compression) [1]. There are 4 IR-TRACC sensors located at different positions along the chest, reflected on the left and right side (see image below). During the crash impact, displacement at each sensor is measured by the deformation or elongation occurring between the origin and the pivot point as a result of the force of impact [1].
 |  |
|---|---|
Figures 1 and 2 were taken from 3D IR-TRACC THOR-50M User Manual [1]
Required Inputs
- Displacement at the Upper Right, Upper Left, Lower Right, and Lower Left Chest IR TRACCs (X, Y, Z)
Calculation
- Identifies ATD used in crash test (either THOR M50 or F05)
- Computes each IR-TRACC's joint center position, length, and resultant displacement for each time step over the time series
- Finds the maximum resultant chest compression and the time of occurrence for each IR-TRACC
- Finds the minimum and maximum X displacement for each IR-TRACC
- Synchronizes time across all the IR-TRACC sensors
- Finds the IR-TRACC with the overall maximum resultant chest compression and the time of occurrence
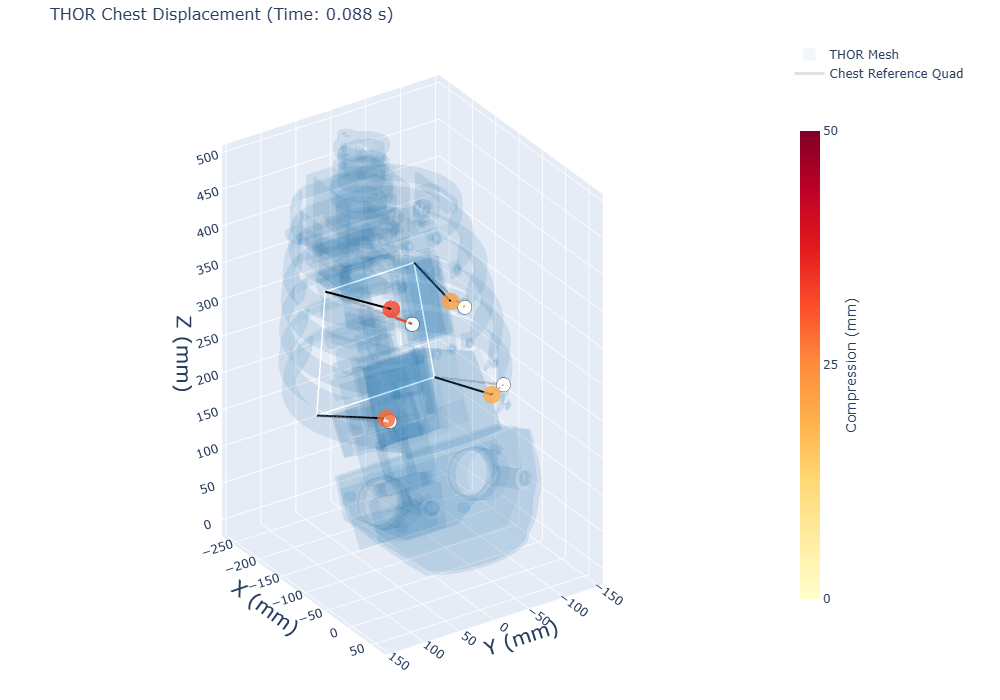
- Generates time series states for all IR-TRACC sensors to create a video of the THOR chest movement throughout the impact
- Returns maximum/min compression and displacement data
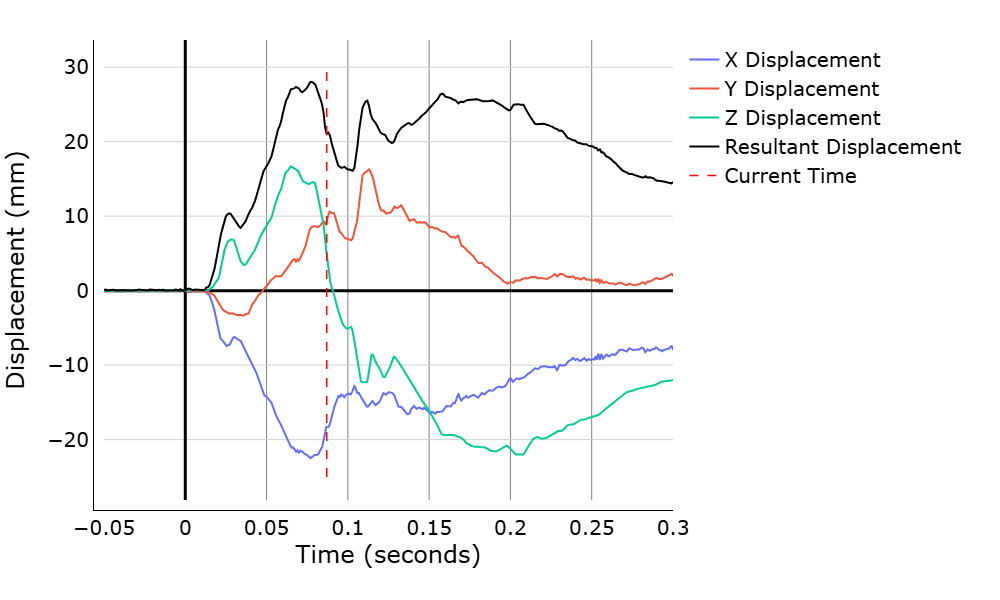
- Generates time-history signals for X, Y, Z, and resultant displacement for each IR-TRACC
- Returns the overall maximum resultant chest compression, the time of occurrence, and the corresponding IR-TRACC region
Example of Chest Deflection Visualization
Citations
[1] Humanetics Innovative Solutions, User Manual, 3D IR_TRACC THOR-50M