Tibia Force
Description
Tibia Force reports peak axial compression at an upper or lower left/right tibia load cell. It compares the peak with the ATD's available reference value and reports THOR AIS 2+ risk when applicable [1] [2].
When this feature is available
Tibia Force becomes available when either the current curve selection or any loaded test contains a tibia measurement set that meets the requirements. Only channels with a usable data status count.
The required measurement set includes:
- The signal attachment must be an upper or lower tibia location, such as
TIBIA - LEFT UPPER,TIBIA - RIGHT UPPER,TIBIA - LEFT LOWER, orTIBIA - RIGHT LOWER. - The group must contain a force channel with:
- Axis:
Z - LOCAL - Units:
NEWTONS
- Axis:
WebSAT checks each tibia attachment independently and enables Tibia Force if any supported left- or right-side measurement set contains the required channel.
Settings
This feature has no settings.
How WebSAT processes the data
- Validate the Z-force channel at the supported tibia attachment.
- Convert the force signal to newtons.
- Filter the signal at CFC 600.
- Trim pre-zero data when it is present.
- Apply the expected compression polarity.
- Find the peak compressive force and its time.
- Use the attachment to select the upper- or lower-tibia IARV and THOR risk relationship.
- Report the peak, percent of IARV, and available injury risk.
Reference values and injury risk
The Hybrid III values follow the published ATD IARVs; THOR and THOR-LX values follow the corresponding THOR injury-criteria definitions [1] [2].
| ATD | Upper tibia IARV (N) | Lower tibia IARV (N) |
|---|---|---|
| Hybrid III 95th male | -9820 | -9820 |
| Hybrid III 50th male | -8000 | -8000 |
| Hybrid III 5th female | -5100 | -5100 |
| THOR 50th male | -7011 | -8017 |
| THOR 5th female | -4000 | -3800 |
| Hybrid III 50th male with THOR-LX legs | -5577 | -5861 |
| Hybrid III 5th female with THOR-LX legs | -4000 | -3800 |
A negative sign denotes compression in the ATD coordinate convention. WebSAT compares force magnitudes when calculating percent of IARV. SID-IIs does not have a tibia-force IARV in the available ATD reference data.
For THOR results, WebSAT uses the peak compressive force in kilonewtons to calculate AIS 2+ probability. It uses separate relationships for the upper and lower tibia [2]:
Other supported ATDs receive IARV and percent-IARV output without a tibia-force probability.
Results
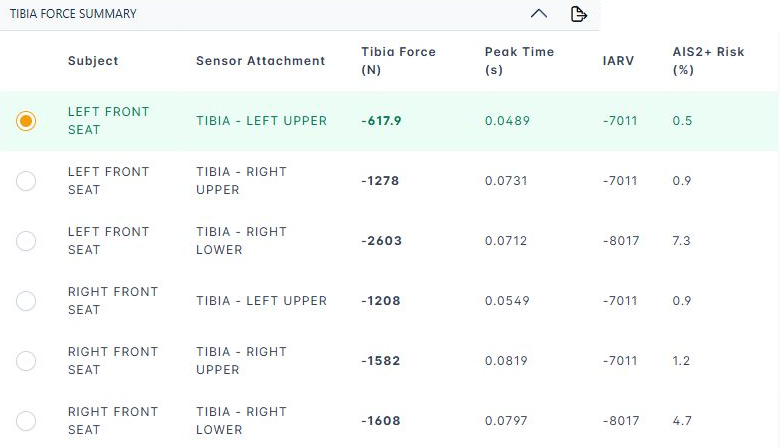
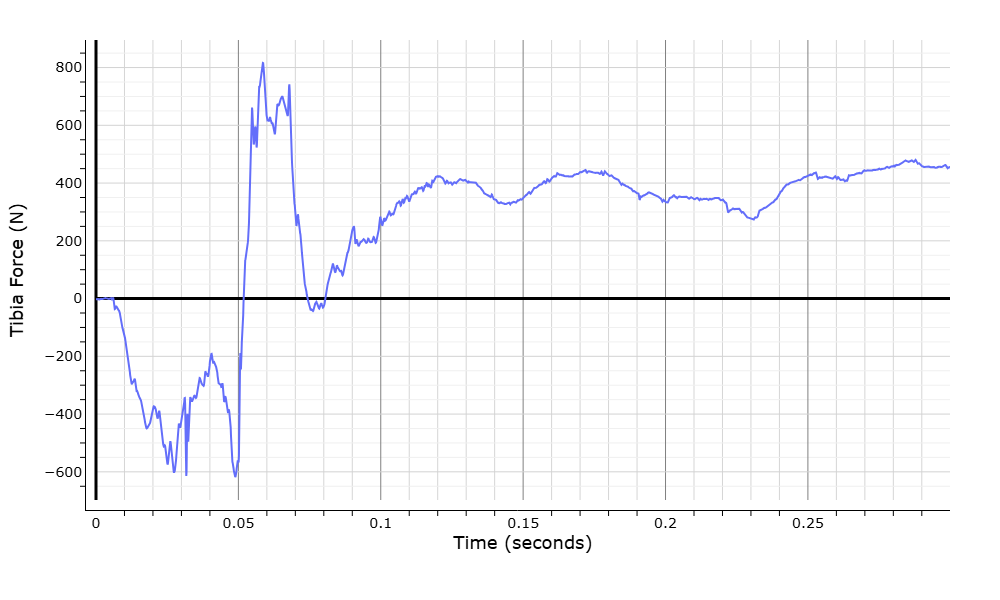
The summary reports test, occupant, tibia attachment, peak compression, peak time, IARV, percent of IARV, and THOR AIS 2+ probability when available. A time-history plot shows the processed force and governing peak.
References
[1] Mertz, H. J., Irwin, A. L., and Prasad, P. “Biomechanical and Scaling Bases for Frontal and Side Impact Injury Assessment Reference Values.” Stapp Car Crash Journal, 47, 2003, pp. 155–188. SAE Technical Paper 2003-22-0009.
[2] Craig, M. et al. Injury Criteria for the THOR 50th Male ATD. National Highway Traffic Safety Administration, 2020.