Pedestrian Protocol
Overview
The Pedestrian Protocol is a comprehensive performance standard developed by NHTSA's New Car Assessment Program (NCAP) [1], built upon the Global Technical Regulation No. 9 (GTR 9) [2] and adapted to US conditions. This protocol evaluates how well a vehicle protects pedestrians during a collision through three key components:
- Head Protection: Simulated head impacts using child and adult headforms on the vehicle hood to assess head injury risk
- Upper Legform Protection: Impact tests on the front bumper using upper legform impactors to evaluate femur force and moment
- Lower Legform Protection: Impact tests on the front bumper using lower legform impactors (FlexPLI) to evaluate femur moment, tibia moment, knee ligament elongation, and knee acceleration
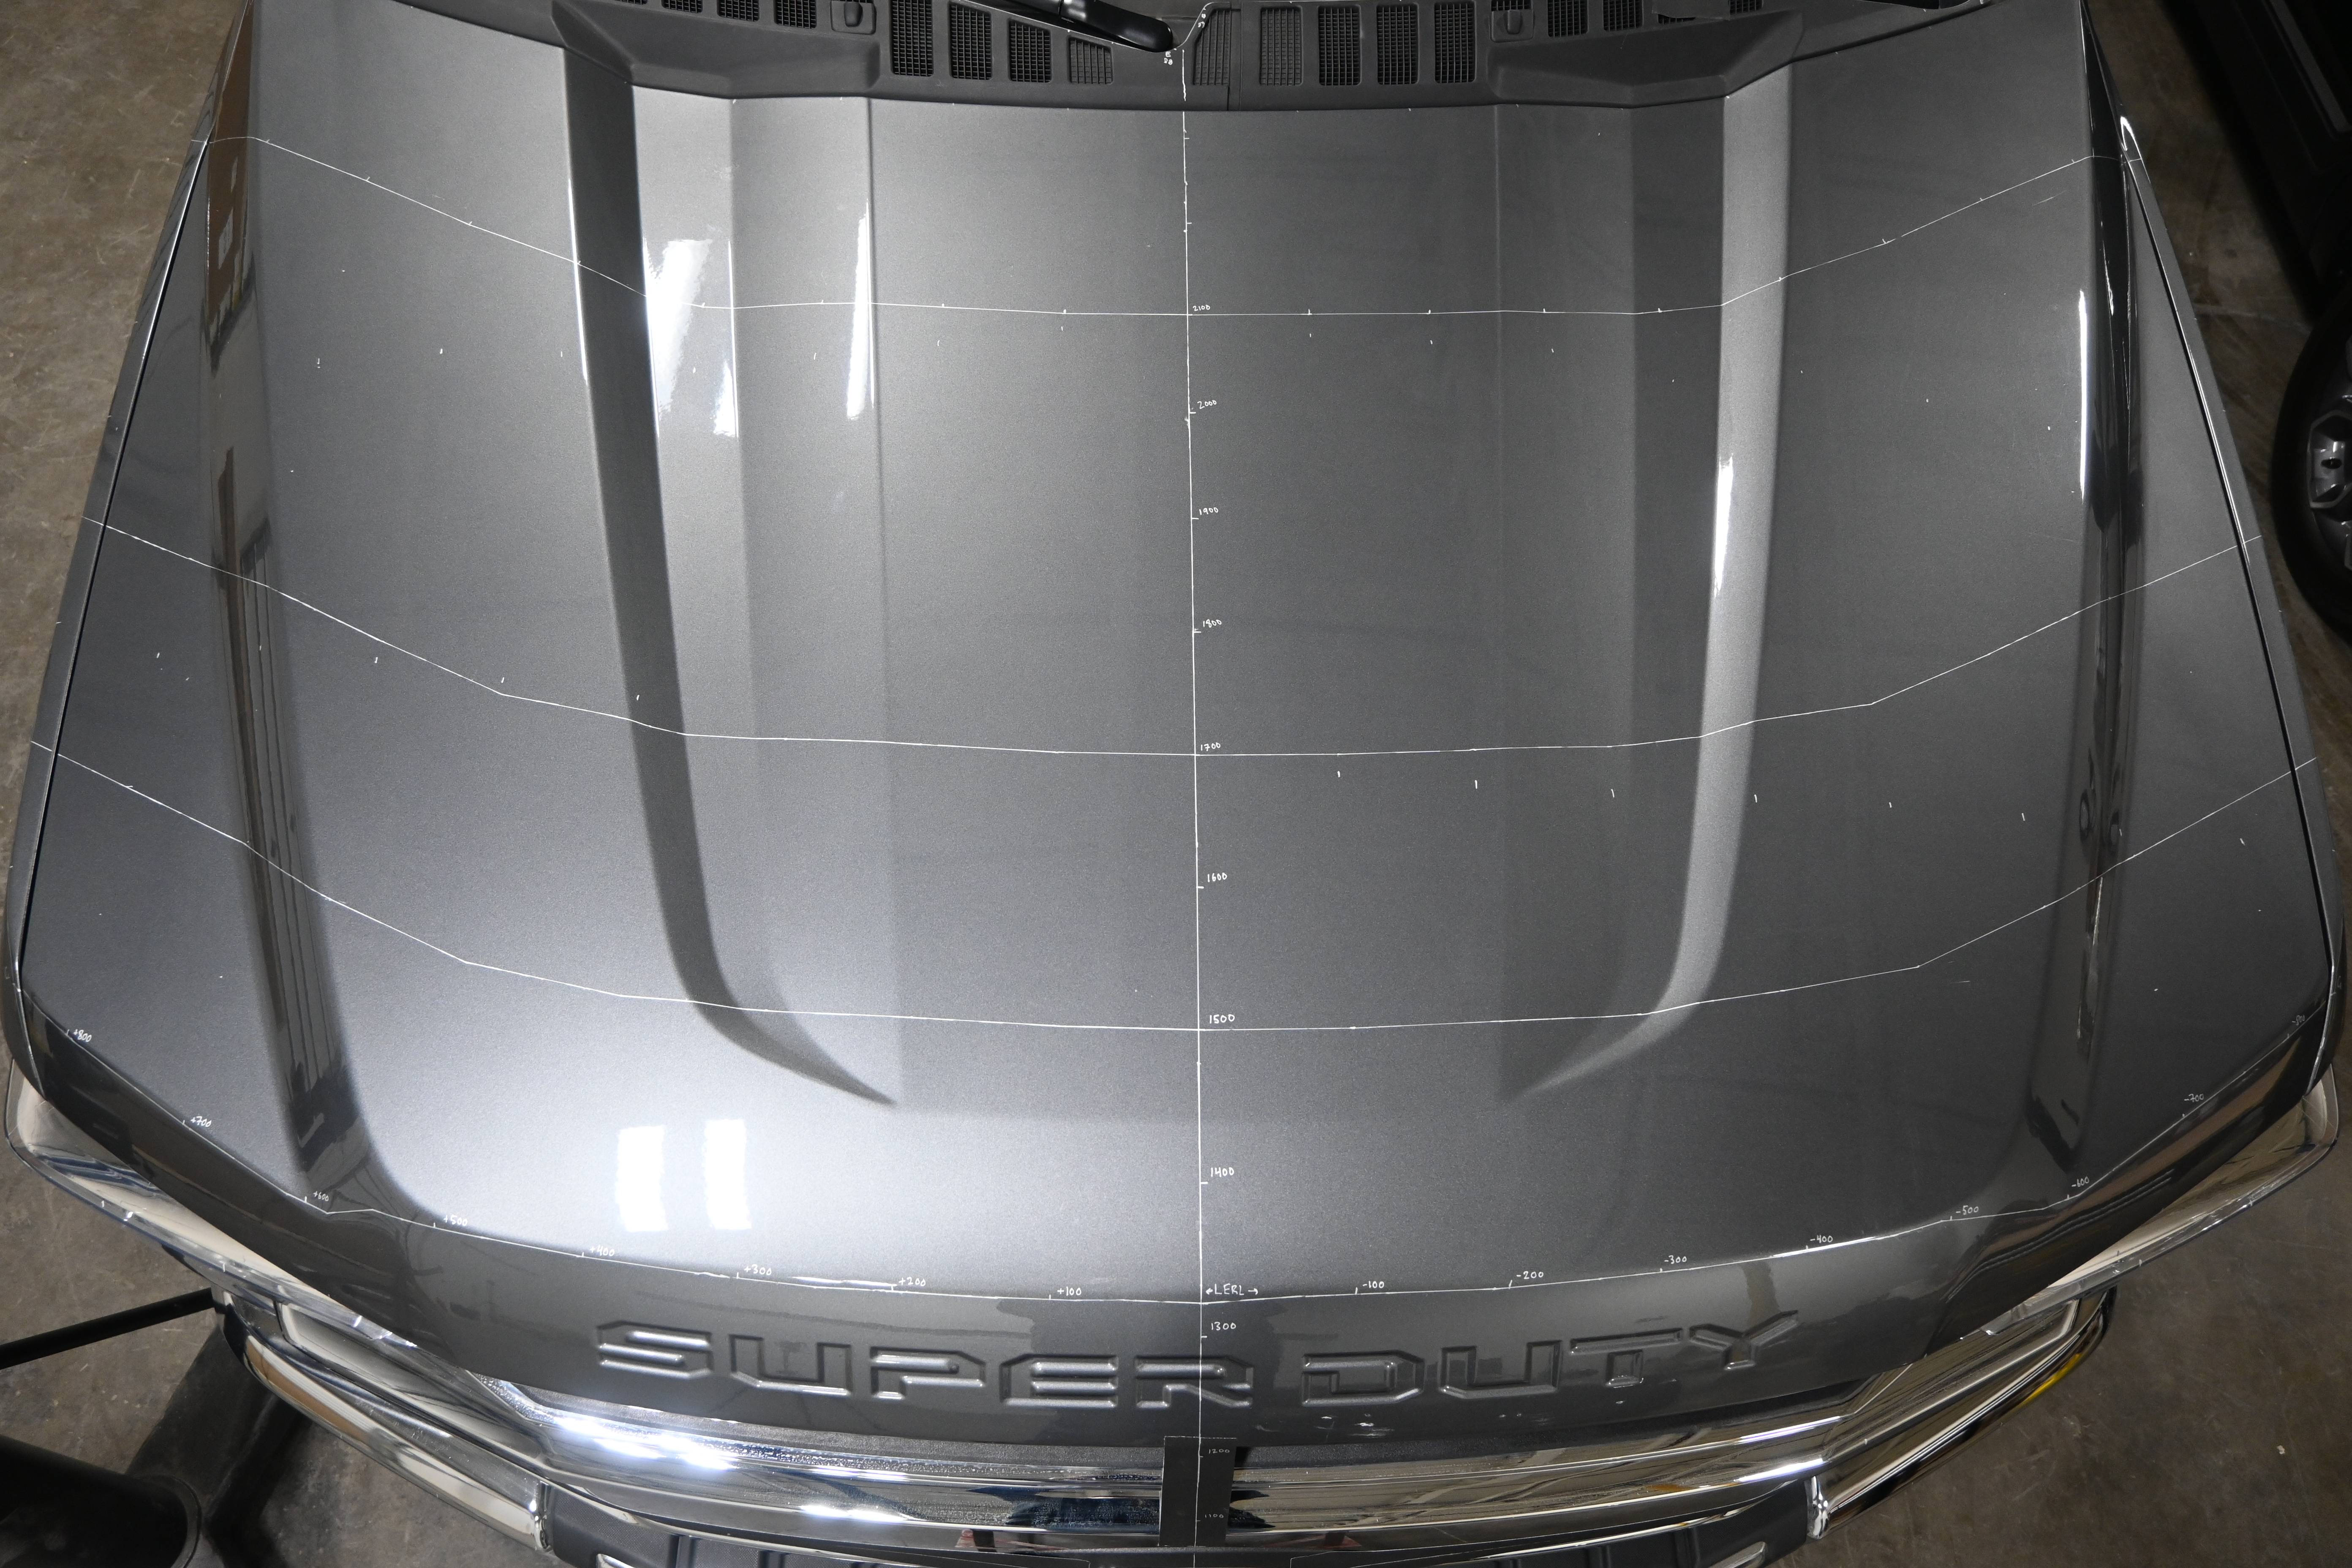
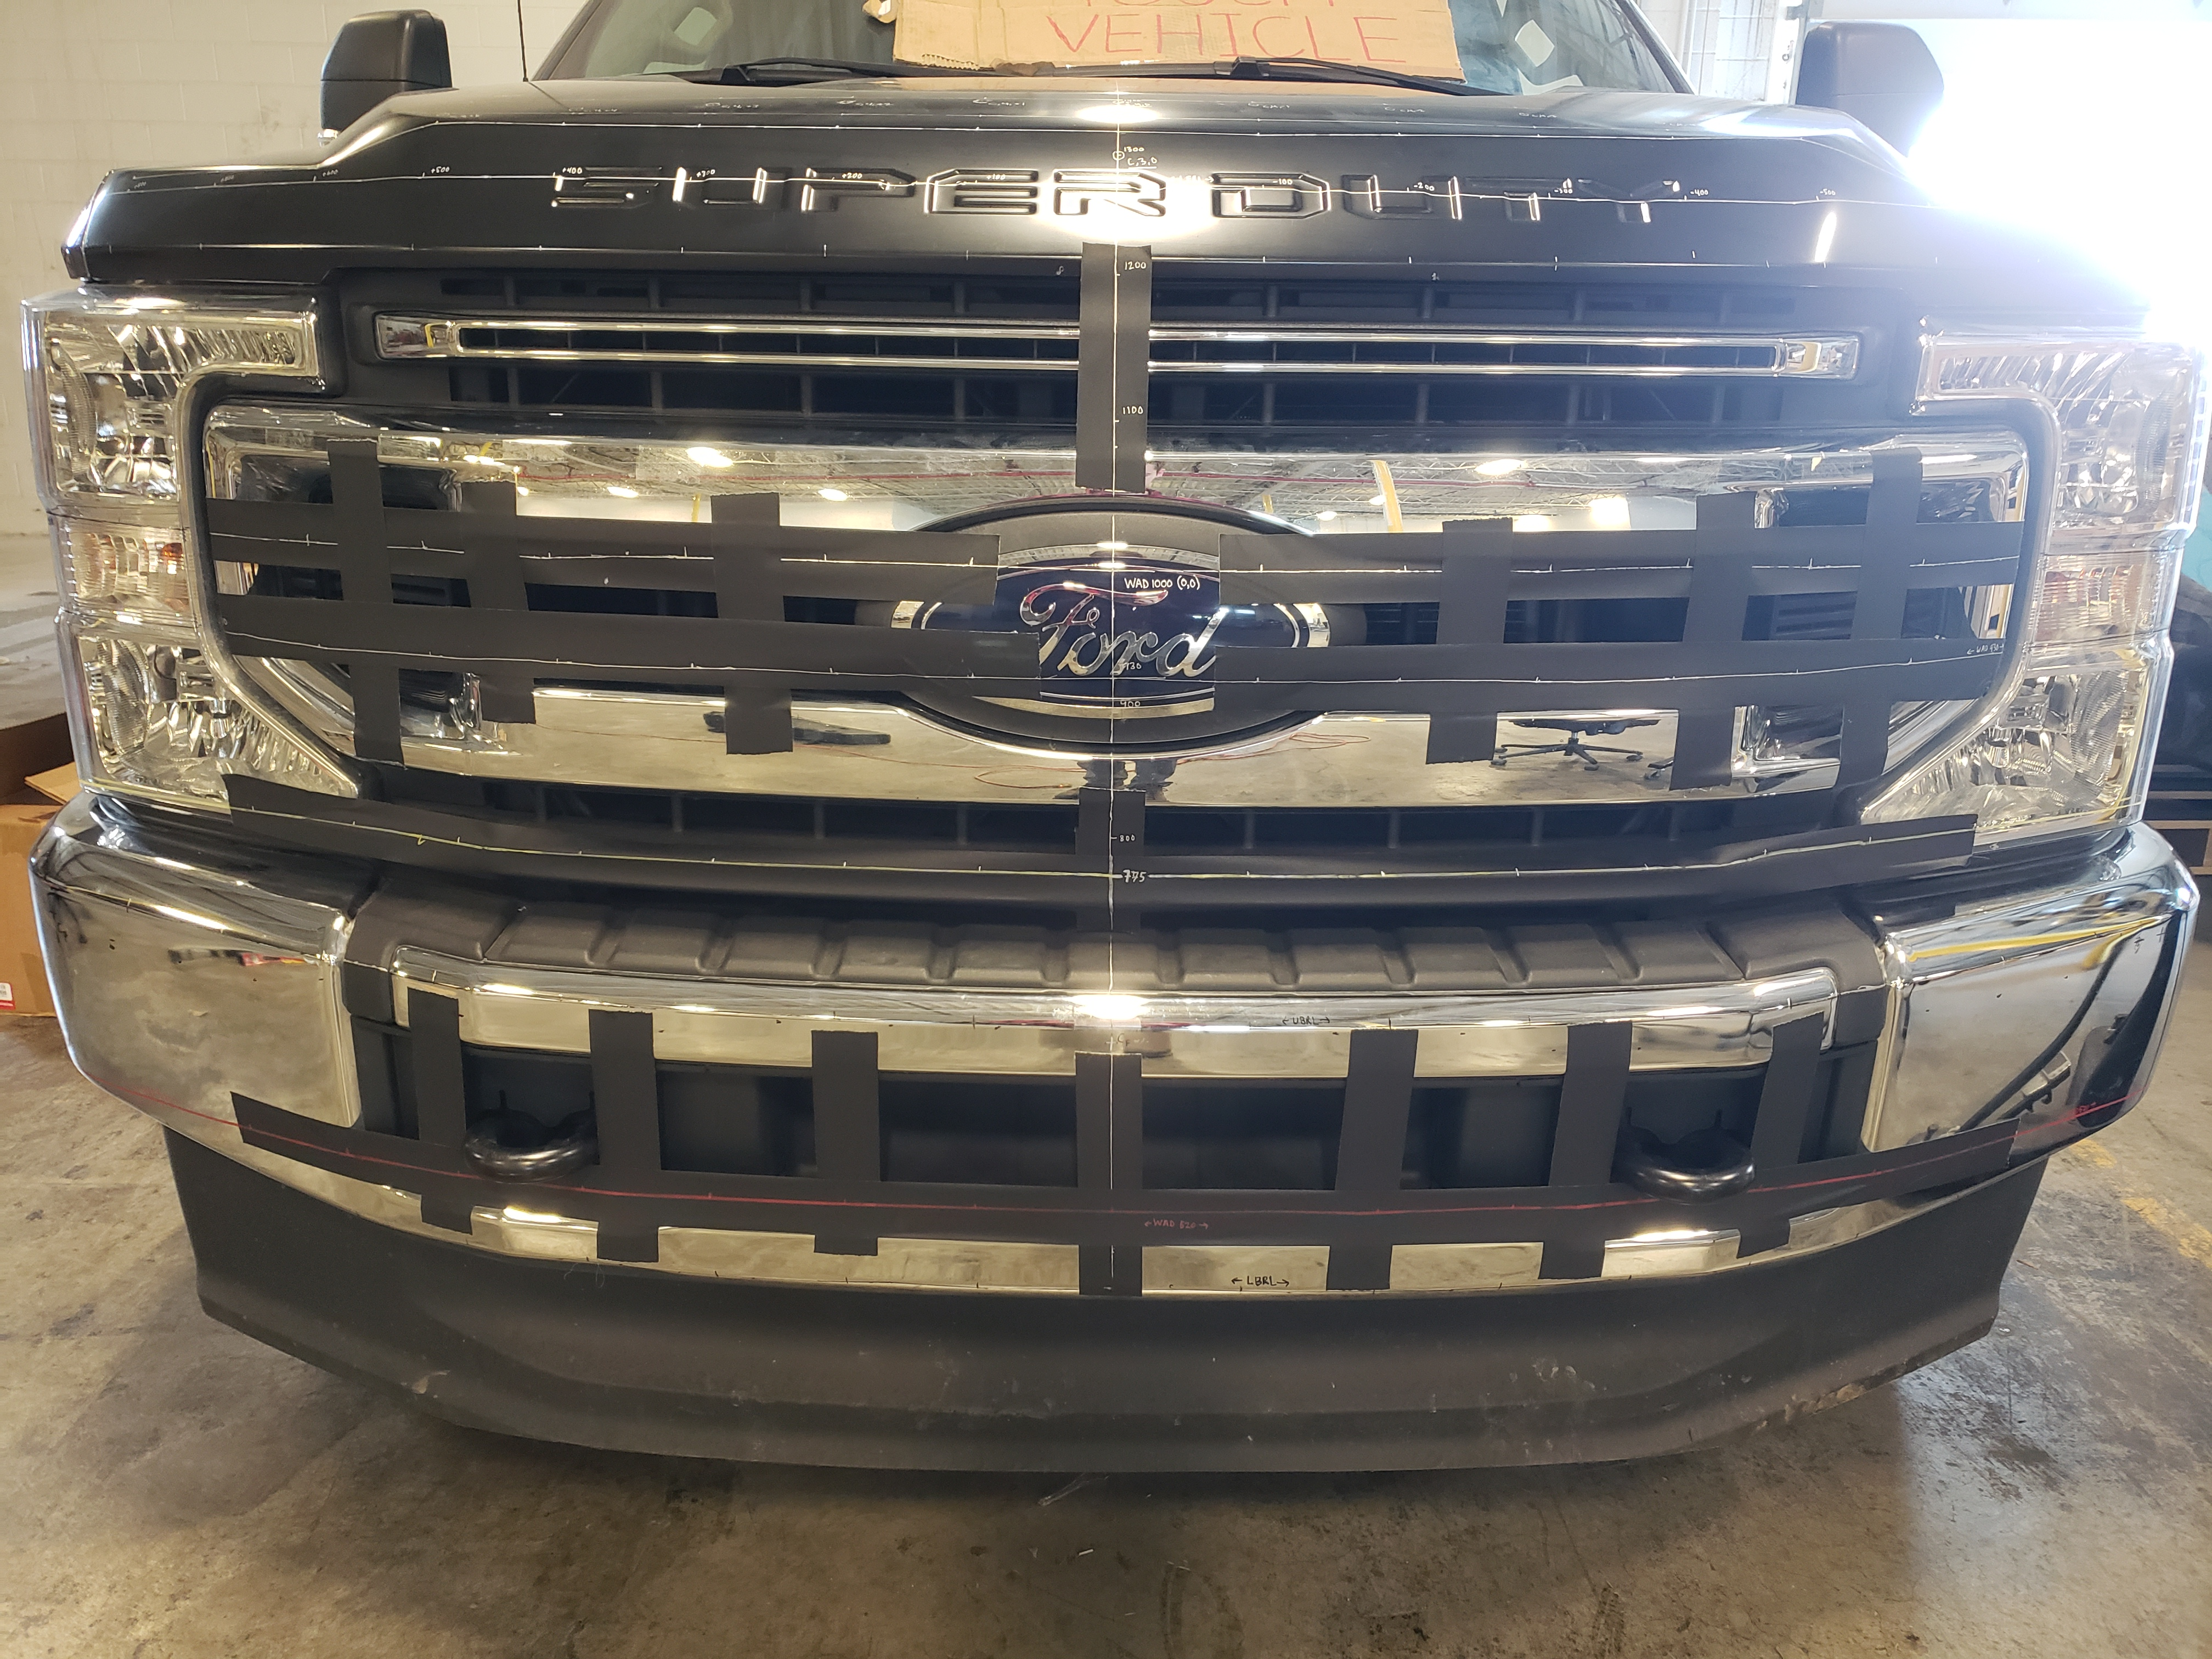
The Pedestrian Protocol function calculates three subscores (Head, Upper Legform, and Lower Legform) which are combined to produce an overall Pedestrian Protocol score. A minimum score of 21.6 is required to pass [1]. The vehicle hood is divided into test areas including Hood Top, Child Headform Test Area, and Adult Headform Test Area, while the front bumper is mapped for upper and lower legform impact locations (see Figures 1 and 2).
 |  |
|---|---|
Figures 1 and 2 were taken from FMVSS No. 228: Pedestrian Head Protection [1]
Inputs
- Vehicle's Hood Top geometry
- Vehicle's Bumper geometry
- Head Linear Acceleration at Head CG (, and )
- Upper Legform Femur Force (X)
- Upper Legform Femur Moment (Y)
- Lower Legform Femur Moment (X)
- Lower Legform Tibia Moment (X)
- Lower Legform Knee ACL, LCL, MCL, PCL Displacement
- Lower Legform Knee Acceleration (Y)
Calculations
- Creates Hood Top Plot based on vehicle's hood geometry with the following areas:
- Hood Top Area
- Front Boundary: Leading Edge Reference Line (LERL)
- Driver Side Boundary: Driver Side Reference Line (SRL)
- Passenger Side Boundary: Passenger Side Reference Line (SRL)
- Rear Boundary: Rear Reference Line (RRL)
- Hood Area
- Front Boundary: WAD1000 or LERL (whichever most rearward)
- Driver Side Boundary: Driver SRL
- Passenger Side Boundary: Passenger SRL
- Rear Boundary: WAD2100 or RRL (whichever most forward)
- Child Headform Test Area
- Front Boundary: WAD1000 or LERL (whichever most rearward)
- Driver Side Boundary: Driver SRL
- Passenger Side Boundary: Passenger SRL
- Rear Boundary: WAD1700 (if exists) or WAD1500
- Adult Headform Test Area
- Front Boundary: WAD1700
- Driver Side Boundary: Driver SRL
- Passenger Side Boundary: Passenger SRL
- Rear Boundary: WAD2100
- Identifies Impact Points within the Child and Adult Headform Test Areas
- Finds , and linear acceleration curves at each impact point
- Each head acceleration is filtered at CFC = 1000
- Calculates the resultant head acceleration at each impact point
- Identifies the launch and impact events in the X-axis head acceleration signal:
- The launch event is the first sustained negative region (≥ 10 ms) of the filtered X-channel acceleration, corresponding to the headform being launched toward the vehicle
- The impact event is the first sustained positive region (≥ 10 ms) of the filtered X-channel acceleration that occurs after the launch event, corresponding to the headform striking the vehicle surface
- A threshold of 5 % of the peak amplitude is used as the region boundary (instead of a strict zero-crossing) to prevent noise near zero from fragmenting a single physical event
- If no qualifying impact region is found, or if the impact region is shorter than the HIC window (15 ms), the full resultant signal is used for HIC calculation
- Truncates the resultant head acceleration to the identified impact event interval
- Calculates Head Injury Criterion (HIC) on the impact event portion of the resultant using Equation 1
where t1 and t2 are any two arbitrary times during the impact event portion of the head CG resultant acceleration pulse a(t)
- Calculates score and assigns color for each impact point based on HIC15 value using Table 1 from NCAP Crashworthiness Pedestrian Protection [1]
| HIC15 Range | Score | Color | Performance |
|---|---|---|---|
| 0 - 649 | 1 | Green | Good |
| 650 - 999 | 0.75 | Yellow | Acceptable |
| 1000 - 1349 | 0.5 | Orange | Marginal |
| 1350 - 1700 | 0.25 | Brown | Poor |
| > 1700 | 0 | Red | Critical |
Table 1: HIC15 Scoring Table from NCAP Crashworthiness Pedestrian Protection [1]
- Calculates Head Subscore using Equation 2
where n is the number of impact points and Score_i is the score at each impact point from Table 1
- Generates a Front Bumper Plot based on vehicle's bumper geometry
- Identifies impact points on the front bumper of the upper and lower legform
- For Upper Legform Impact Points:
- Identifies Femur Force and Femur Moment signals at each impact point
- Applies CFC = 180 filter to Femur Force and Femur Moment signals
- Calculates sum of Femur Force signals at each impact point
- Finds peak value of sum of femur force signals at each impact point
- Finds peak value of Femur Moment signals at each impact point
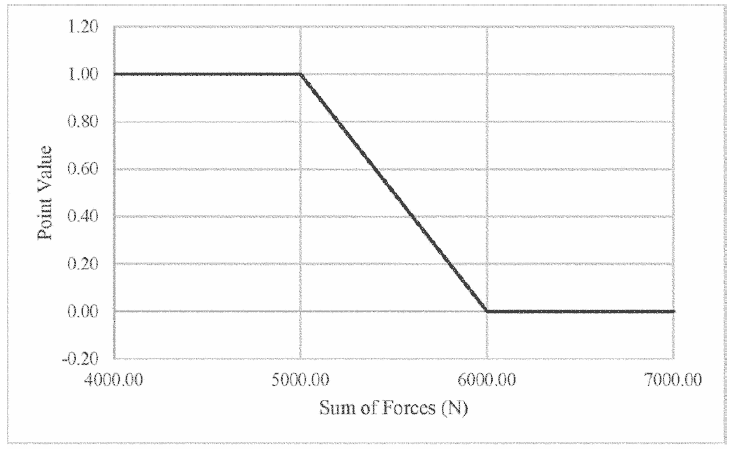
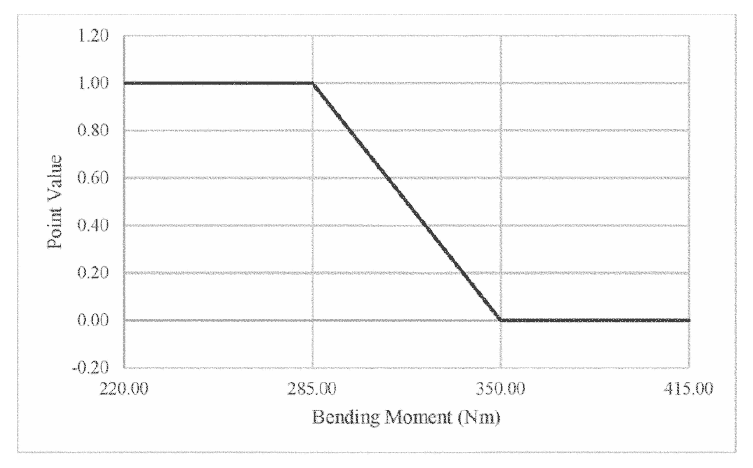
- Calculates score for sum of femur force and femur moments (upper, middle, lower) at each impact point based on peak values using Figures 3 and 4 from NCAP Crashworthiness Pedestrian Protection [1]
 |  |
|---|---|
Figures 3 and 4 were taken from NCAP Crashworthiness Pedestrian Protection [1]
- Finds worst scores out of the four signals (sum of femur force, upper femur moment, middle femur moment, lower femur moment) and assigns that score to each impact point
- Assigns color for each impact point using Table 2 from NCAP Crashworthiness Pedestrian Protection [1]
| Score | Color | Performance |
|---|---|---|
| 1 | Green | Good |
| 0.75 - 0.99 | Yellow | Acceptable |
| 0.50 - 0.749 | Orange | Marginal |
| 0.25 - 0.499 | Brown | Poor |
| 0.0 - 0.249 | Red | Critical |
Table 2: Legform Scoring Table from NCAP Crashworthiness Pedestrian Protection [1]
- Calculates Upper Legform Subscore using Equation 3
where n is the number of impact points and Score_i is the worst score at each impact point from Table 2
- Impact points are reflected across the y-axis and assigned the same score as the original impact point
- Impact midpoints are added between each pair of impact points and assigned the worst score of the two adjacent impact points
- For Lower Legform Impact Points:
- Identifies Femur Moment, Tibia Moment, Knee ACL, LCL, MCL, PCL Displacement, and Knee Acceleration signals at each impact point
- Applies CFC = 180 filter to Femur Moment, Tibia Moment, Knee Displacement, and Knee Acceleration signals
- Finds peak value of Tibia Moment and Knee MCL Displacement signals at each impact point and assigns a point value using Figures 5 and 6 from NCAP Crashworthiness Pedestrian Protection [1]
- If the ACL or PCL displacement exceeds 10 mm at any impact point, the MCL Elongation score for that impact point is automatically set to 0
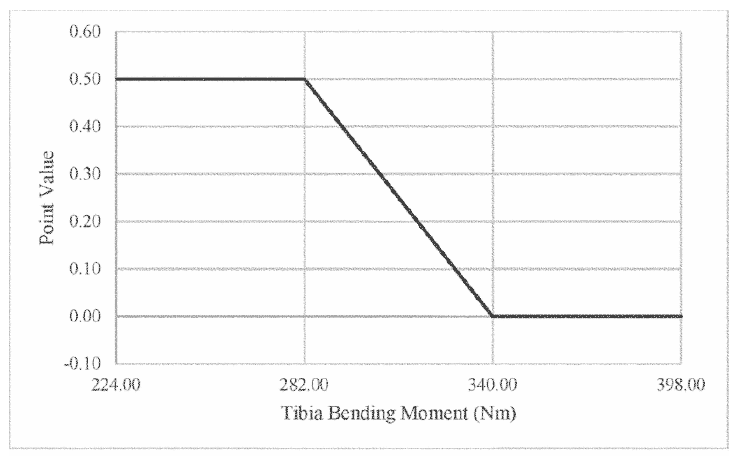 | 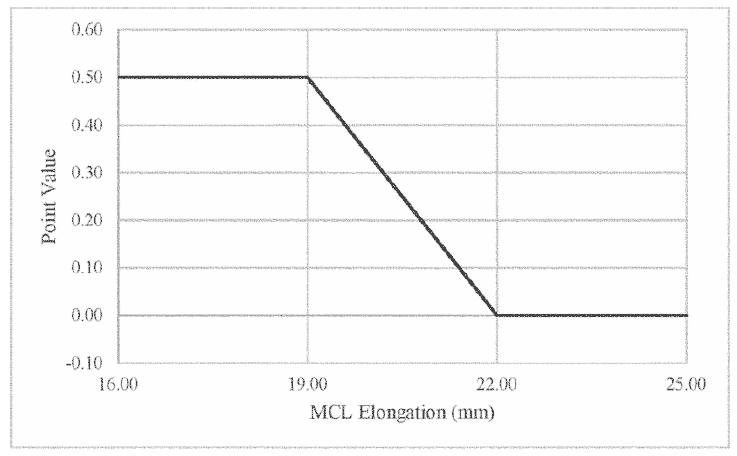 |
|---|---|
Figures 5 and 6 were taken from NCAP Crashworthiness Pedestrian Protection [1]
- Calculates an overall score for each impact point by multiplying the MCL Elongation point value by 0.5, multiplying the worst Tibia Moment point value by 0.5, and adding them together
- Assigns color for each impact point based on point value calculated in the step above using Table 2 from NCAP Crashworthiness Pedestrian Protection [1]
- Calculates Lower Legform Subscore using Equation 4
- Impact points are reflected across the y-axis and assigned the same score as the original impact point
- Impact midpoints are added between each pair of impact points and assigned the worst score of the two adjacent impact points
where n is the number of impact points and Score_i is the worst score at each impact point from Table 2
- Calculates overall pedestrian protocol score by adding the individual Head Subscore, Upper Legform Subscore, and Lower Legform Subscore together
- According to NCAP Crashworthiness Pedestrian Protection [1], the minimum passing score for the pedestrian protocol is 21.6
Generated Figure
References
[1] National Highway Traffic Safety Administration. Federal Motor Vehicle Safety Standards; Pedestrian Head Protection, Global Technical Regulation No. 9; Incorporation by Reference. U.S. Department of Transportation, 20 Nov. 2024.
[2] United Nations Economic Commission for Europe. Global Technical Regulation No. 9: Pedestrian Safety. United Nations, 2009.