Pedestrian Protection
Description
Pedestrian Protection is a comprehensive performance evaluation developed by NHTSA's New Car Assessment Program (NCAP). It is based on European NCAP (Euro NCAP) requirements and is adapted to US conditions [1]. It evaluates pedestrian protection with three subscores:
| Subscore | Maximum points |
|---|---|
| Head | 18 |
| Upper Legform | 9 |
| Lower Legform | 9 |
| Pedestrian Protection Score | 36 |
A minimum total score of 21.6 is required to pass [1]. WebSAT maps the hood for child and adult headform impacts and maps the front bumper for upper and lower legform impacts.
When this feature is available
The Pedestrian Protection function is available for NCAP and GTR component tests that have both geometry and configuration information. WebSAT uses Pedestrian Hood Areas for FMVSS component tests. WebSAT identifies the required measurements from the loaded test. You do not select curves for this feature.
The active test must meet these conditions:
- The loaded test must be a component test.
- The title or test reference number must contain
NCAPorGTR. - The loaded test must include geometry and configuration information.
- The loaded test must include at least one channel with a usable data status so WebSAT can associate the component information with the test.
- The title or test reference number must not contain
FMVSS; WebSAT routes those records to Pedestrian Hood Areas even when they also mention GTR. - At least one upper- or lower-legform configuration must supply every channel its test device needs.
WebSAT does not require every legform configuration to be complete. A configuration that is short of a required channel still appears in the table and scores zero. Missing or unclassifiable headform channels limit individual head point scores in the same way.
Settings
This feature has no settings. Geometry, configurations, impact points, measurements, and test results come from the loaded test.
How WebSAT processes the data
- Load and map the hood and bumper test geometry.
- Associate the available response channels with each configuration and impact point.
- Process headform points:
- Load the manufacturer-predicted color range for every head grid point and the head verification correction factor.
- Compare each verification impact with the prediction at its grid point, and derive the correction factor from those results [1]. Use the loaded factor where the test reports one, and the derived factor where it does not.
- Filter head X/Y/Z acceleration at CFC 1000.
- Identify the impact portion and calculate resultant acceleration and HIC15.
- Assign the protocol score to each point.
- Apply the correction factor to the non-default predicted point scores. Do not apply it to default-green or default-red points.
- Keep cyclist impact results visible when they are rearward of WAD2100, but exclude them from the Head Subscore.
- Process upper-legform points:
- Filter femur forces and moments at CFC 180.
- Calculate summed force and peak bending moments.
- Assign the worst response score at each point.
- Process lower-legform points:
- Filter femur/tibia moments, knee-ligament elongations, and knee acceleration at CFC 180.
- Score tibia moment and MCL elongation.
- Apply the protocol's ACL/PCL override.
- Reflect measured points and fill symmetric and adjacent grid locations as required by the test procedure [2].
- Calculate the Head Subscore from all predicted head grid points and the correction factor. Average the upper- and lower-leg point scores within each region.
- Apply the 18/9/9 weighting and sum the three subscores. If the head prediction data is not usable, or no correction factor is available, report the Head Subscore and total as N/A.
- Display the mapped point results, regional scores, and total score.
Injury reference values and scoring functions
Head impact point scoring
| HIC15 | Point score | Display |
|---|---|---|
| Less than 650 | 1.00 | Good / green |
| 650 to less than 1000 | 0.75 | Acceptable / yellow |
| 1000 to less than 1350 | 0.50 | Marginal / orange |
| 1350 to less than 1700 | 0.25 | Poor / brown |
| 1700 or greater | 0.00 | Critical / red |
Upper- and lower-leg responses use the force, moment, and ligament-elongation scoring curves in the NCAP final decision [1]. Between each full-score and zero-score value below, WebSAT reduces the score linearly.
| Response | Full score at or below | Zero score at or above | Maximum point contribution |
|---|---|---|---|
| Upper-leg sum of femur forces | 5000 N | 6000 N | 1.00 |
| Upper-leg femur bending moment | 285 N·m | 350 N·m | 1.00 |
| Lower-leg tibia bending moment | 282 N·m | 340 N·m | 0.50 |
| Lower-leg MCL elongation | 19 mm | 22 mm | 0.50 |
The worst relevant upper-leg response governs each point. The lower-leg score adds the MCL-elongation and worst tibia-moment contributions. ACL or PCL elongation over 10 mm sets the MCL contribution to zero.
For the Head Subscore, WebSAT applies the correction factor only to the non-default predicted point scores:
In this formula, is the head verification correction factor, is a non-default predicted point score, is a default-green or default-red point score, and is the total number of head grid points. A default-green point has a score of 1.00. A default-red point has a score of 0.00.
The overall score is:
WebSAT uses 21.6 points as the minimum passing score.
Results
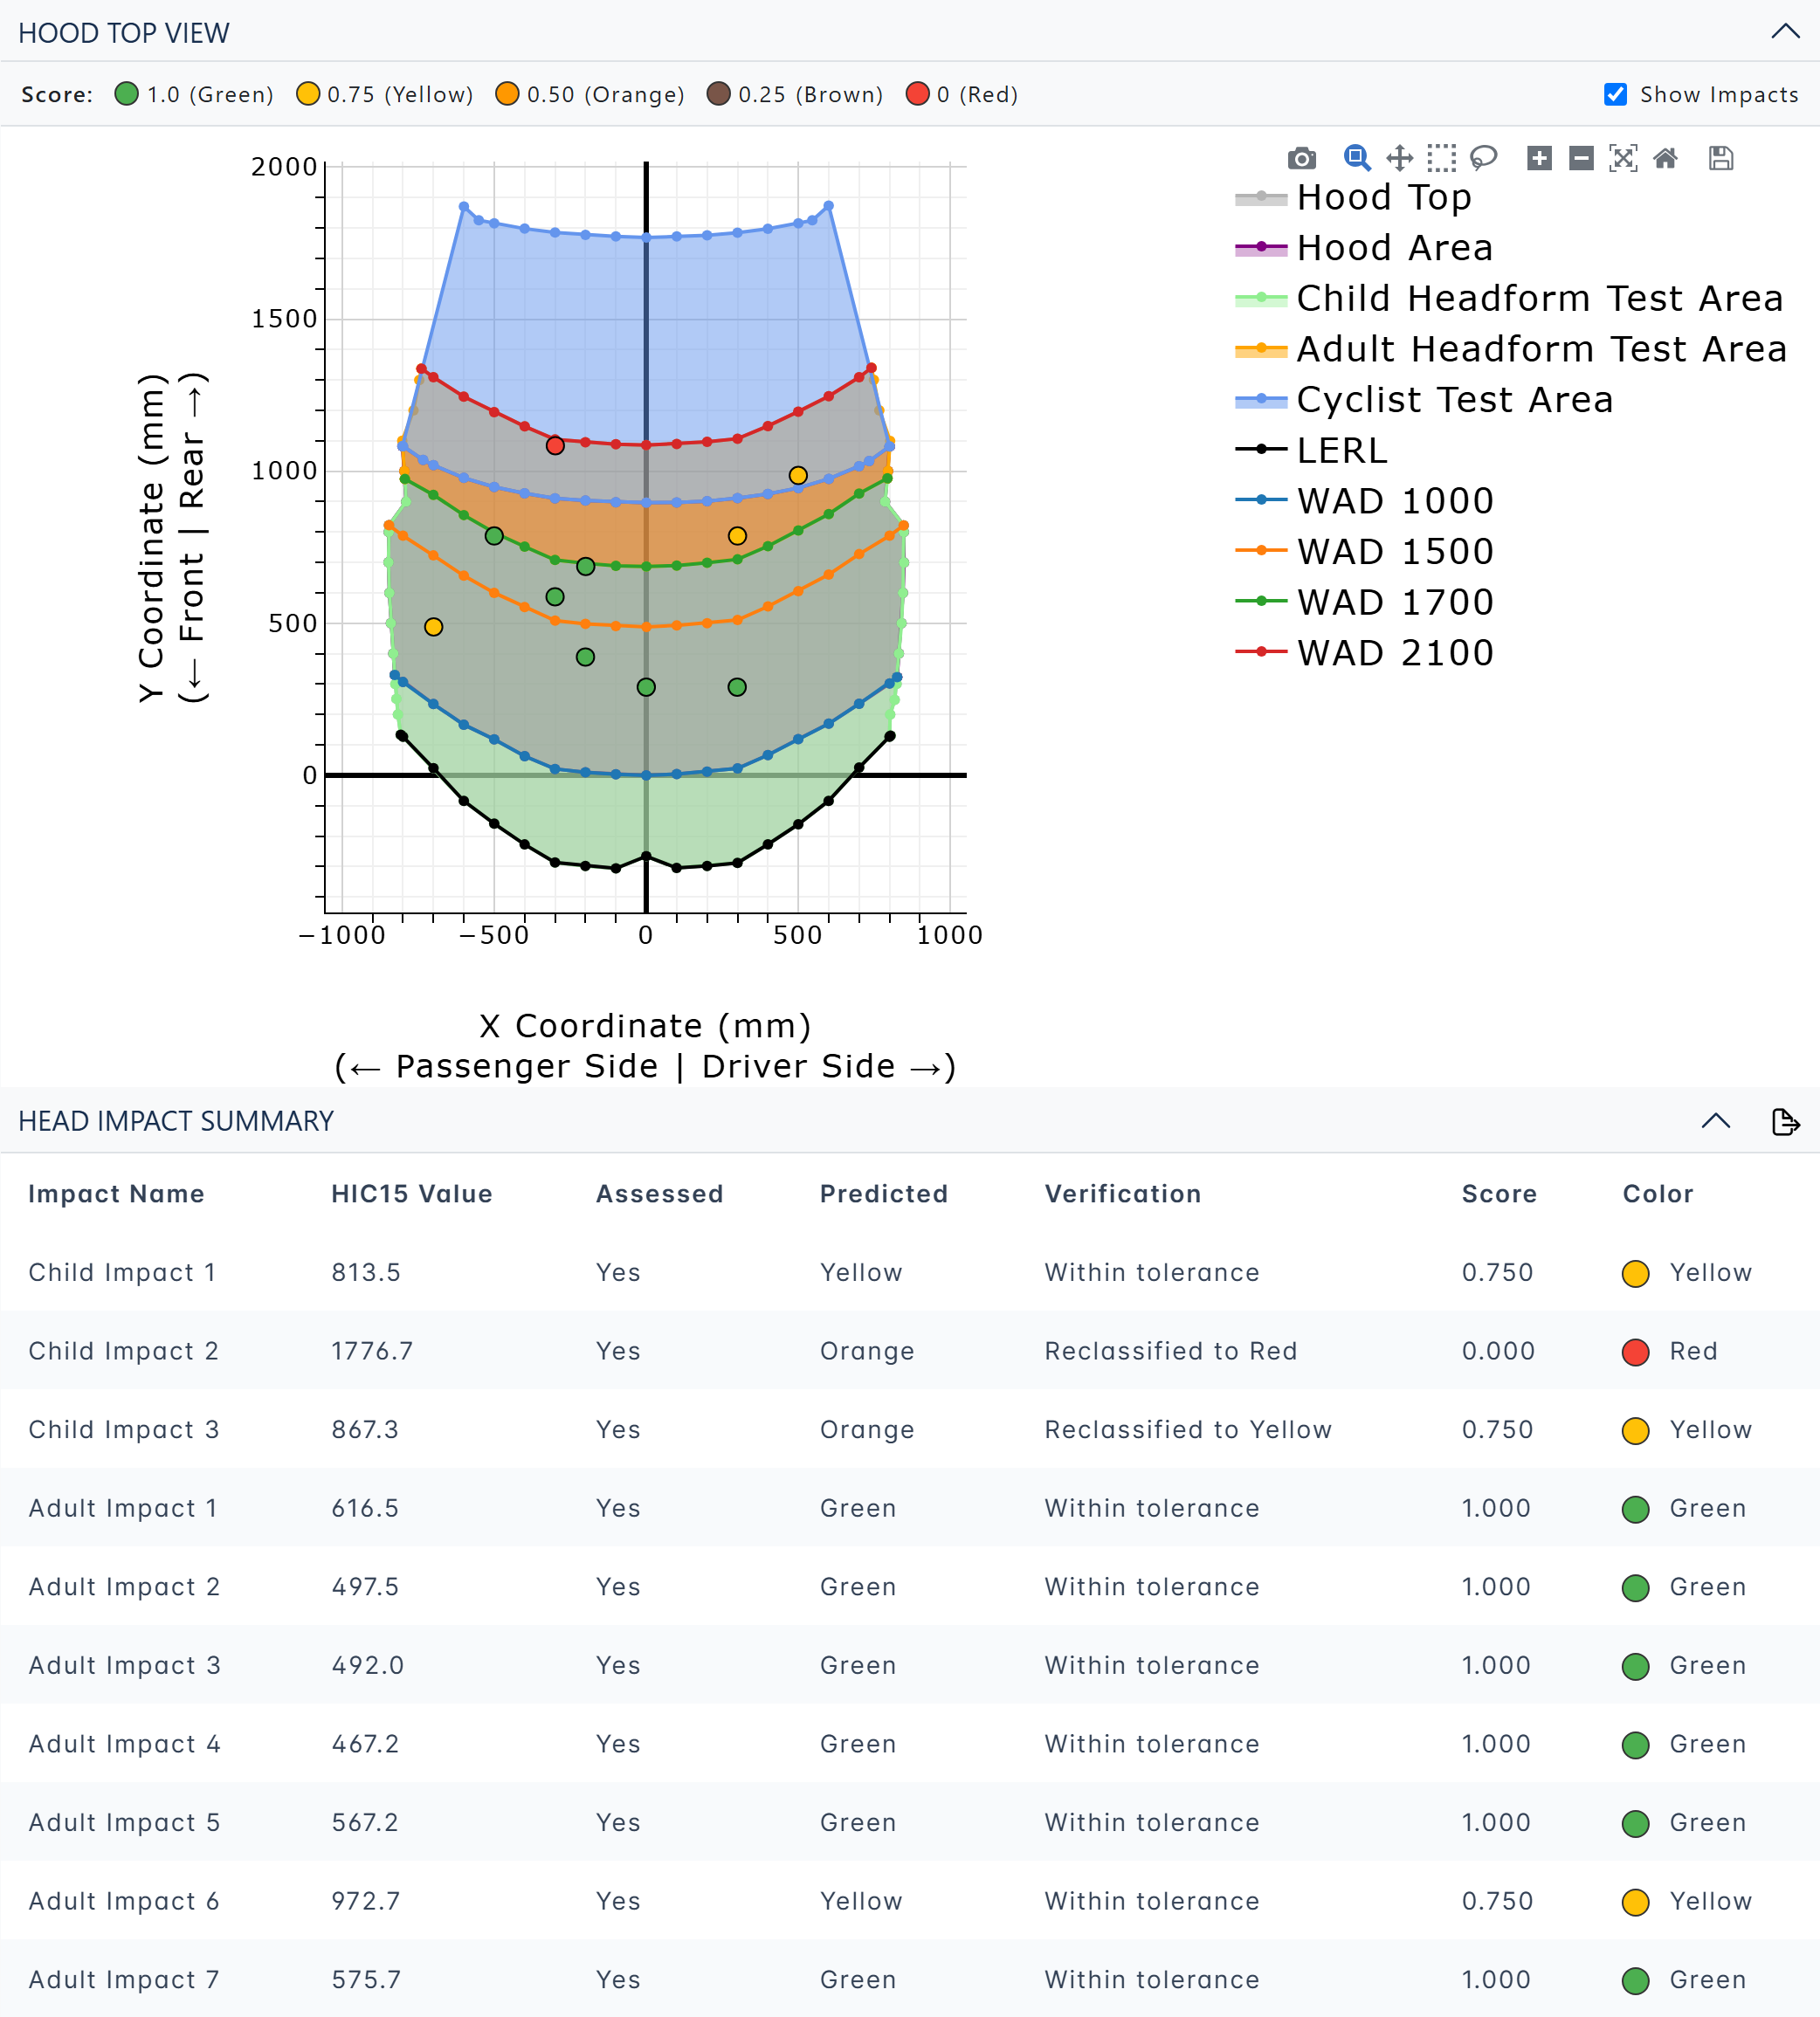
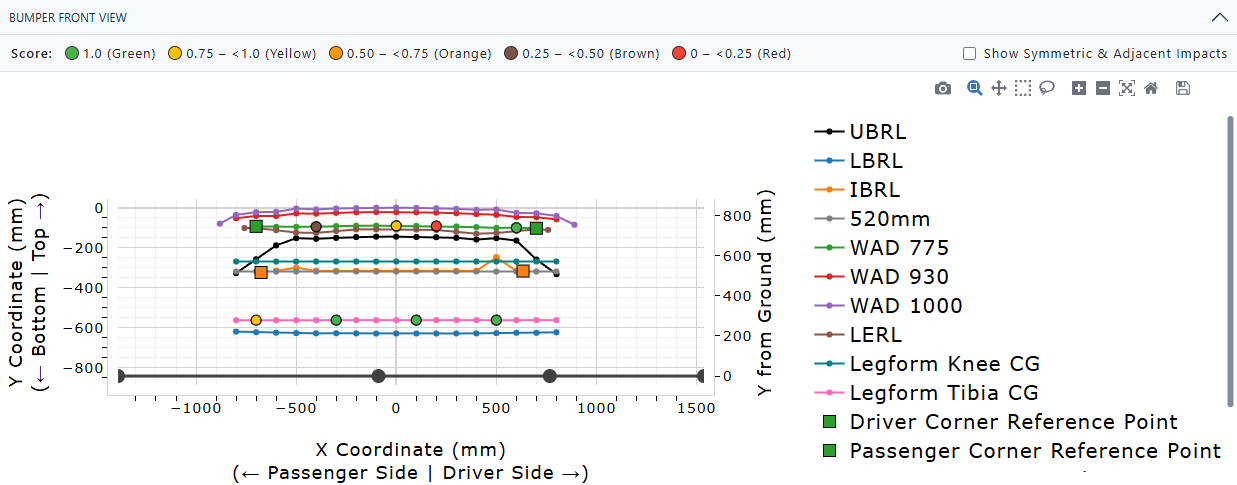
The Pedestrian Protection Summary table lists the Head, Upper Leg, and Lower Leg subscores, the head correction factor, and the total score for each vehicle. Select a row to update the plots and impact tables. An information icon beside a value gives the reason for it: a subscore that is not available, a legform grid location that no result reached, or a derived correction factor that does not agree with the loaded one. The Head Subscore and total are N/A when the loaded test does not give a usable color at every head grid point, or when no correction factor is available. The physical head impact results remain available in the Head Impact Summary.
On the Hood Top View plot, use Show Impacts to show or hide the head impact markers. Select a row in Head Impact Summary to open the resultant head-acceleration curve. The shaded interval is the 15 ms interval used for HIC15. A cyclist impact remains visible with its HIC15 value, point value, and color, but it does not contribute to the Head Subscore.
On the Bumper Front View plot, use Show Symmetric & Adjacent Impacts to add those grid points to the plot and legform tables. Select a tested row to open its curves. A derived row shows the values from the tested point that supplies its score.
Tested rows include a configuration number and no origin suffix. Generated rows identify their origin in the point name, either (Symmetric) or (Adjacent). The number in a grid label is the sequential position counted outward from the vehicle centerline. The table order follows the plot from the passenger side toward the driver side.
For each legform table, WebSAT calculates the subscore as:
The denominator includes tested and generated grid points. A grid location that no test, symmetry, or adjacency result reaches scores zero and stays in the denominator. The subscore names those locations, because the test procedure answers an unreached location with a test [2]. WebSAT reports a zero subscore only when the geometry does not give the extent of the grid.
The impact summary tables report:
- Head Impact Summary: HIC15 Value, Assessed, Predicted, and Verification. Predicted gives the color the manufacturer submitted for that grid point. Verification shows Within tolerance where the measured HIC15 keeps that color, and the new color where it does not. The test procedure permits a 10 percent tolerance on each color band [1].
- Upper Legform Impact Summary: Sum Femur Force (N) and Max. Femur Moment (N·m)
- Lower Legform Impact Summary: Max. Tibia Moment (N·m), MCL Elongation (mm), and the ACL and PCL results as Pass, Fail, or Missing. If the ACL or PCL result is above 10 mm, the MCL Elongation point value is zero.
A value of N/A or a gray marker means that WebSAT could not calculate the value from the loaded data. Review the geometry, configurations, measurement labels, and signal status. A displayed impact does not always contribute to a subscore.
References
[1] National Highway Traffic Safety Administration. New Car Assessment Program Final Decision Notice: Crashworthiness Pedestrian Protection. 89 FR 92720, U.S. Department of Transportation, 25 Nov. 2024. https://www.federalregister.gov/documents/2024/11/25/2024-27446/new-car-assessment-program-final-decision-notice-crashworthiness-pedestrian-protection
[2] National Highway Traffic Safety Administration. New Car Assessment Program Pedestrian Protection Test Procedure. U.S. Department of Transportation, June 2025.